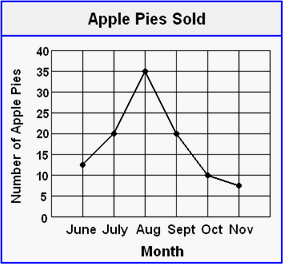
| Skill 9G Line Bar Graph Here we determine if your student can get information from a line graph. This requires understanding of the meaning of the "dots" on the graph. The line
graph shows the number of apple pies sold at Johnson's Bakery for 6 months. Answer
the questions below the line graph. |
||||||
 |
||||||
| 1. | In what month were the most pies sold? | |||||
| 2. | In what month were fewer than 10 apple pies sold? | |||||
| 3. | In what months were 20 or more pies sold? | |||||
| 4. | How many more pies were sold in September than October? | |||||